Predictive Analytics in Business: How ML Models Are Replacing Gut Decisions
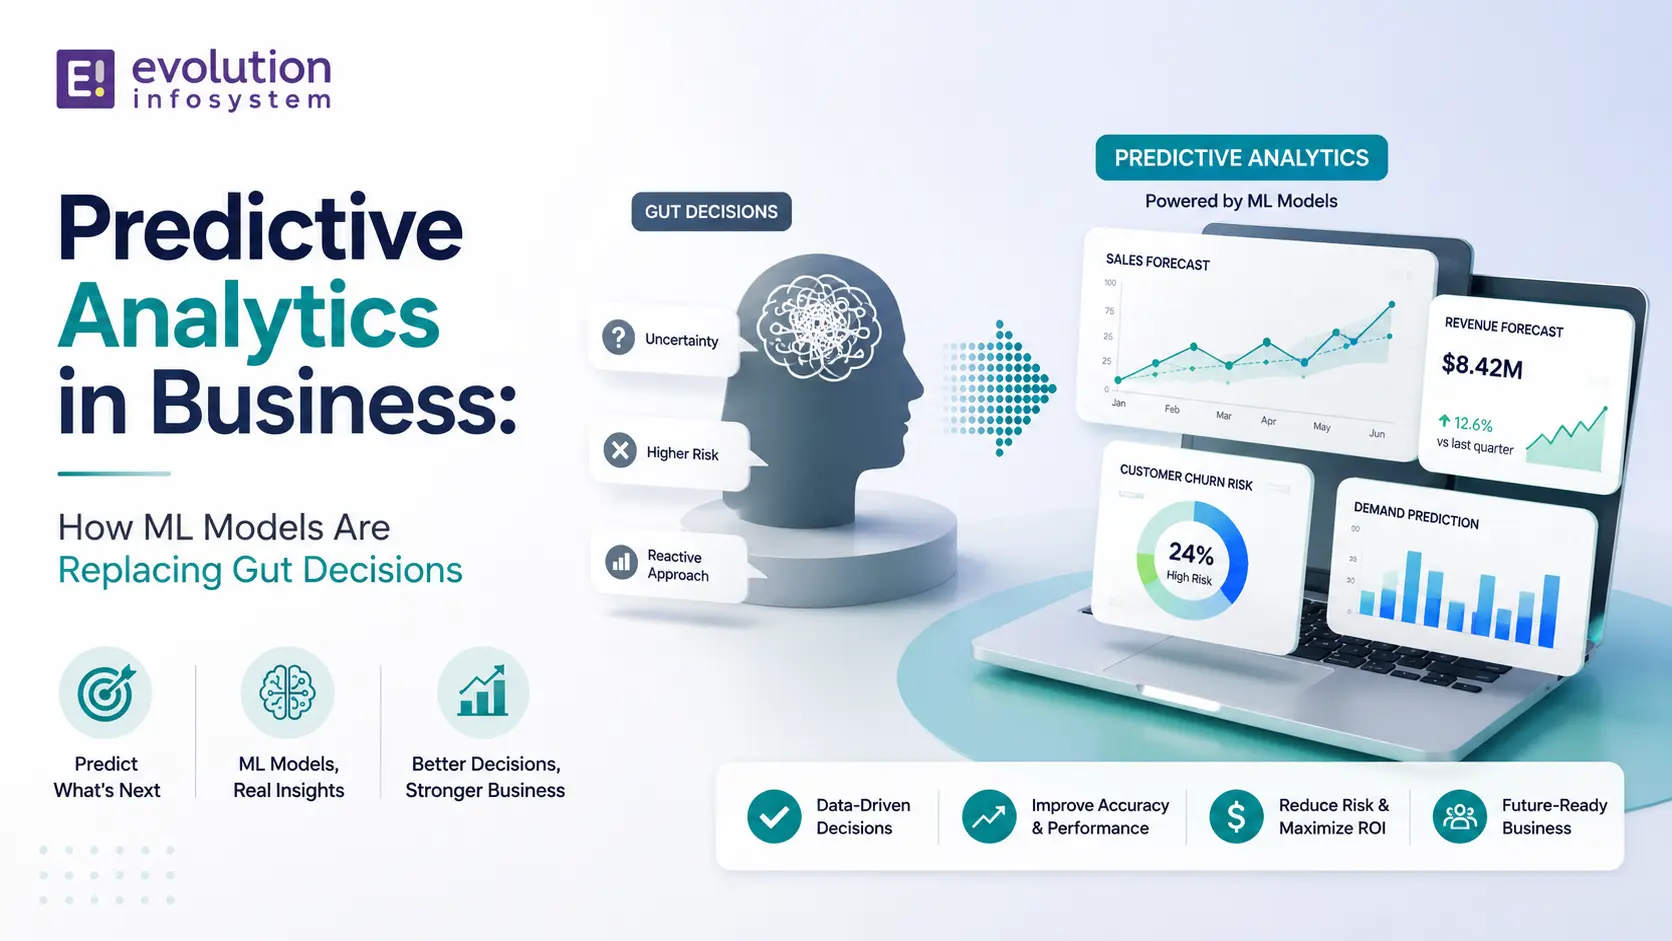
Every business makes predictions. The question is whether those predictions are made with data or with intuition dressed up as experience.
Sales forecasts set to whatever this quarter needs to be. Inventory orders based on last year plus a percentage. Customer churn identified when it’s already happened. Marketing budgets allocated based on what worked before, applied to a market that’s changed.
Predictive analytics in business replaces these intuition-driven estimates with models trained on historical data that identify patterns humans can’t detect at scale and translate them into forward-looking decisions with measurable accuracy.
The technology is not new. What has changed is the accessibility. Machine learning tooling that required teams of data scientists five years ago is now accessible to businesses with a single data analyst and the right platform. The barrier is no longer technical capability – it’s knowing which problems are worth solving with ML and how to implement it correctly.
What Predictive Analytics Actually Does
Predictive analytics uses historical data to build statistical models that predict future outcomes. The output is a probability or a predicted value – not a certainty, but a systematically better estimate than intuition alone.
The three core outputs of predictive analytics:
➜ Classification: assigns a probability to a categorical outcome. Will this customer churn in the next 90 days? Yes or no, with a probability score. Will this transaction be fraudulent? Is this lead likely to convert?
➜ Regression: predicts a continuous numerical value. What will next month’s demand be for this SKU? What is this customer’s lifetime value likely to be? What price should we charge to maximise margin while remaining competitive?
➜ Anomaly detection: identifies observations that differ significantly from the expected pattern. A transaction that looks unlike any legitimate transaction from this account. A machine sensor reading that deviates from the normal operating envelope. A supplier delivery time that’s an outlier in both directions.
Where Predictive Analytics Delivers Real Business Value
Churn Prediction
Customer churn is one of the highest-ROI applications of predictive analytics because the intervention is available – you can act on a churn prediction before the customer actually leaves.
A churn prediction model is trained on historical customer behaviour: login frequency, feature usage, support ticket volume, contract renewal history, and any other signal available in your data. The model identifies the pattern that precedes churn – not the moment it’s already happened, but the 30–90 days of declining engagement that predict it.
The output: a probability score per customer, updated regularly. Customers above a defined threshold are flagged for proactive intervention – a customer success call, a targeted offer, a usage review. Businesses that implement churn prediction consistently report 15–25% reductions in churn rate among the high-risk segment they’re able to reach in time.
The data requirement: 12–24 months of customer behaviour data with labelled churn events (which customers churned and when). The model is only as good as the data it’s trained on.
Demand Forecasting
Manual demand forecasting – last year’s sales plus a growth assumption, adjusted for seasonality – consistently produces either overstock or stockout. Both are expensive: overstock ties up working capital and drives markdown losses; stockout loses sales and damages customer trust.
Machine learning demand forecasting models incorporate: historical sales data at the SKU level, promotional calendar, pricing history, weather and seasonality, macroeconomic indicators, and sometimes external data like competitor pricing and search trend data. The resulting forecast is significantly more accurate than manual methods, particularly for products with complex seasonal patterns or high variability.
In supply chain contexts, demand forecast accuracy improvements of 20–40% are regularly reported in ML model implementations. At meaningful inventory scale, this accuracy improvement translates directly into working capital efficiency and margin improvement.
Lead Scoring and Sales Prioritisation
Sales teams work with more leads than they can actively pursue. The instinct is to work the largest deals or the most recent inbound. Neither is necessarily the best use of selling time.
ML-based lead scoring models train on historical closed-won and closed-lost data to identify the characteristics that predict conversion: company size, industry, engagement pattern (email opens, page visits, content downloads), firmographic signals, and time-in-funnel. Each incoming lead is scored, and the sales team prioritises the highest-probability pipeline.
The commercial outcome: higher close rates because selling time is concentrated on leads that are actually likely to convert. Faster pipeline velocity because high-score leads receive earlier attention. More accurate revenue forecasting because pipeline probability is based on data rather than sales rep optimism.
Predictive Maintenance
Industrial equipment fails on a schedule that’s influenced by operational conditions, not just calendar time. A pump that runs at high load in hot conditions will fail sooner than the same pump in normal conditions. Standard preventive maintenance schedules don’t account for this variation.
ML predictive maintenance models ingest sensor data – vibration, temperature, current draw, pressure – and identify the pattern that precedes failure. Maintenance is scheduled based on predicted remaining useful life rather than calendar interval.
The operational impact is twofold: unplanned downtime from unexpected failures drops because failures are predicted before they occur, and unnecessary preventive maintenance is reduced because parts are serviced based on actual condition, not a conservative schedule.
Dynamic Pricing
Static pricing – set a price, review it quarterly – leaves money on the table in markets where willingness to pay varies by demand, competition, inventory level, and time. Dynamic pricing models predict the price point that maximises revenue or margin given current conditions.
Dynamic pricing is well-established in airlines, hotels, and ride-sharing. E-commerce, SaaS, and B2B businesses are applying the same principles: adjusting prices based on demand signals, inventory levels, competitive positioning, and customer segment.
The implementation requires real-time pricing capability in the commerce platform, a model that makes fast pricing decisions at scale, and guardrails (price floors and ceilings) that prevent the model from producing prices that damage brand trust.
Credit Risk and Fraud Detection
Financial services applications of predictive analytics are among the most mature and most commercially consequential. Credit risk models predict the probability of default from a combination of financial history, behavioural signals, and third-party data. Fraud detection models identify transactions that deviate from the expected pattern for that account and user.
Both applications work on the same principle: the model identifies patterns in historical data that correlate with future outcomes (default or fraud) and applies that pattern recognition to new cases in real time.
What Predictive Analytics Actually Requires
➜ Data.
ML models require data – enough of it, at the right quality, covering the right time period. A churn prediction model needs at minimum 12 months of customer behaviour data with accurate churn labels. A demand forecasting model needs 2–3 years of sales history to capture seasonality reliably. Data quality problems (missing values, inconsistent labelling, wrong timestamps) directly degrade model quality.
➜ Feature engineering.
Raw data rarely feeds directly into a model. Feature engineering is the process of transforming raw data into the signals the model can learn from. For a churn model, this might mean: days since last login (not the raw timestamp), count of support tickets in the last 30 days (not the raw ticket records), ratio of features used to features available. This process requires domain expertise about which signals matter for your specific prediction problem.
➜ Baseline comparison.
Every ML model should be compared against the baseline it’s replacing. If your current lead scoring is a sales rep’s intuition that produces a 20% conversion rate, the model should demonstrably outperform 20% before it’s deployed. If your current demand forecast has a mean absolute percentage error of 25%, the model should deliver lower MAPE before it’s justified.
➜ Monitoring.
Models trained on historical data can drift when the world changes. A churn model trained before a major product change may not correctly model churn drivers after the change. A demand model trained before a competitive entry may over-forecast. Production ML models require monitoring for prediction accuracy over time and retraining when accuracy degrades.
At Evolution Infosystem, we build predictive intelligence systems for demand forecasting, churn prediction, lead scoring, and operational optimisation. We start with the business question, work backward to the data requirements, and build models that produce decisions – not just predictions. Let’s talk about what you want to predict.
Frequently Asked Questions (FAQs)
What is predictive analytics in business?
Predictive analytics uses machine learning models trained on historical data to predict future outcomes – customer churn, product demand, lead conversion probability, equipment failure, fraud. It replaces intuition-driven estimates with data-driven probability scores that enable more accurate and more timely business decisions.
What data do I need to start with predictive analytics?
The data requirement depends on the prediction problem. Churn prediction requires 12–24 months of customer behaviour data with accurate churn labels. Demand forecasting requires 2–3 years of sales history at the SKU level. Lead scoring requires historical closed-won and closed-lost data with deal characteristics. The consistent requirements across all problems: sufficient volume, accurate labels, and consistent data quality over time.
What is the difference between predictive analytics and business intelligence?
Business intelligence (BI) describes what happened – dashboards and reports on historical performance. Predictive analytics predicts what will happen – probability scores and forecast values for future outcomes. Both are valuable. BI tells you where you are. Predictive analytics tells you where you’re going and which interventions are likely to change the outcome.
How accurate are predictive analytics models?
Accuracy depends on data quality, problem complexity, and the baseline being compared against. Well-implemented churn models typically achieve 70–85% accuracy in identifying churners before they leave. Demand forecasting models typically reduce forecast error by 20–40% versus manual methods. Lead scoring models reliably improve conversion rates when selling time is concentrated on high-score leads. No model is perfect – the question is whether it’s meaningfully better than the alternative.
How long does it take to implement a predictive analytics solution?
A focused predictive analytics solution – one prediction problem, clean data, clear business objective – typically takes 8–14 weeks from data assessment to production deployment. This includes data preparation, feature engineering, model training and evaluation, integration with operational systems, and monitoring setup. Broader implementations across multiple prediction problems take longer proportionally.